Debugging in ARKit & SceneKit
If you’ve been working on any AR application (or 3D by extension) for some time, I can swear you faced a situation where things are not working as expected but you don’t know exactly why. Typically, software developers rely on console messages and / or breakpoints to deal with this situations and for most of these scenarios, these will do the trick, but when we dive into the AR world, we’ll soon find that we have more verticals to cover and in many cases these methods are not enough.
Let’s go through few tips I use in my daily basis to diagnose and fix these kind of issues.
View hierarchy
One of the biggest issues building AR content is usually managing the hierarchy of nodes in a scene. Sometimes nodes are out of place or not showing up in the scene at all.
Fortunately, Xcode offers a way to completely halt our app execution and be able to fully inspect the scene hierarchy. Let’s take a look at how this works:
First open an AR view in your app and make sure it is visible on the screen, then click the Debug View Hierarchy button.

Depending of your scene complexity, it will take a while for Xcode to capture the full hierarchy. Once it’s finished, you should see something similar to this:
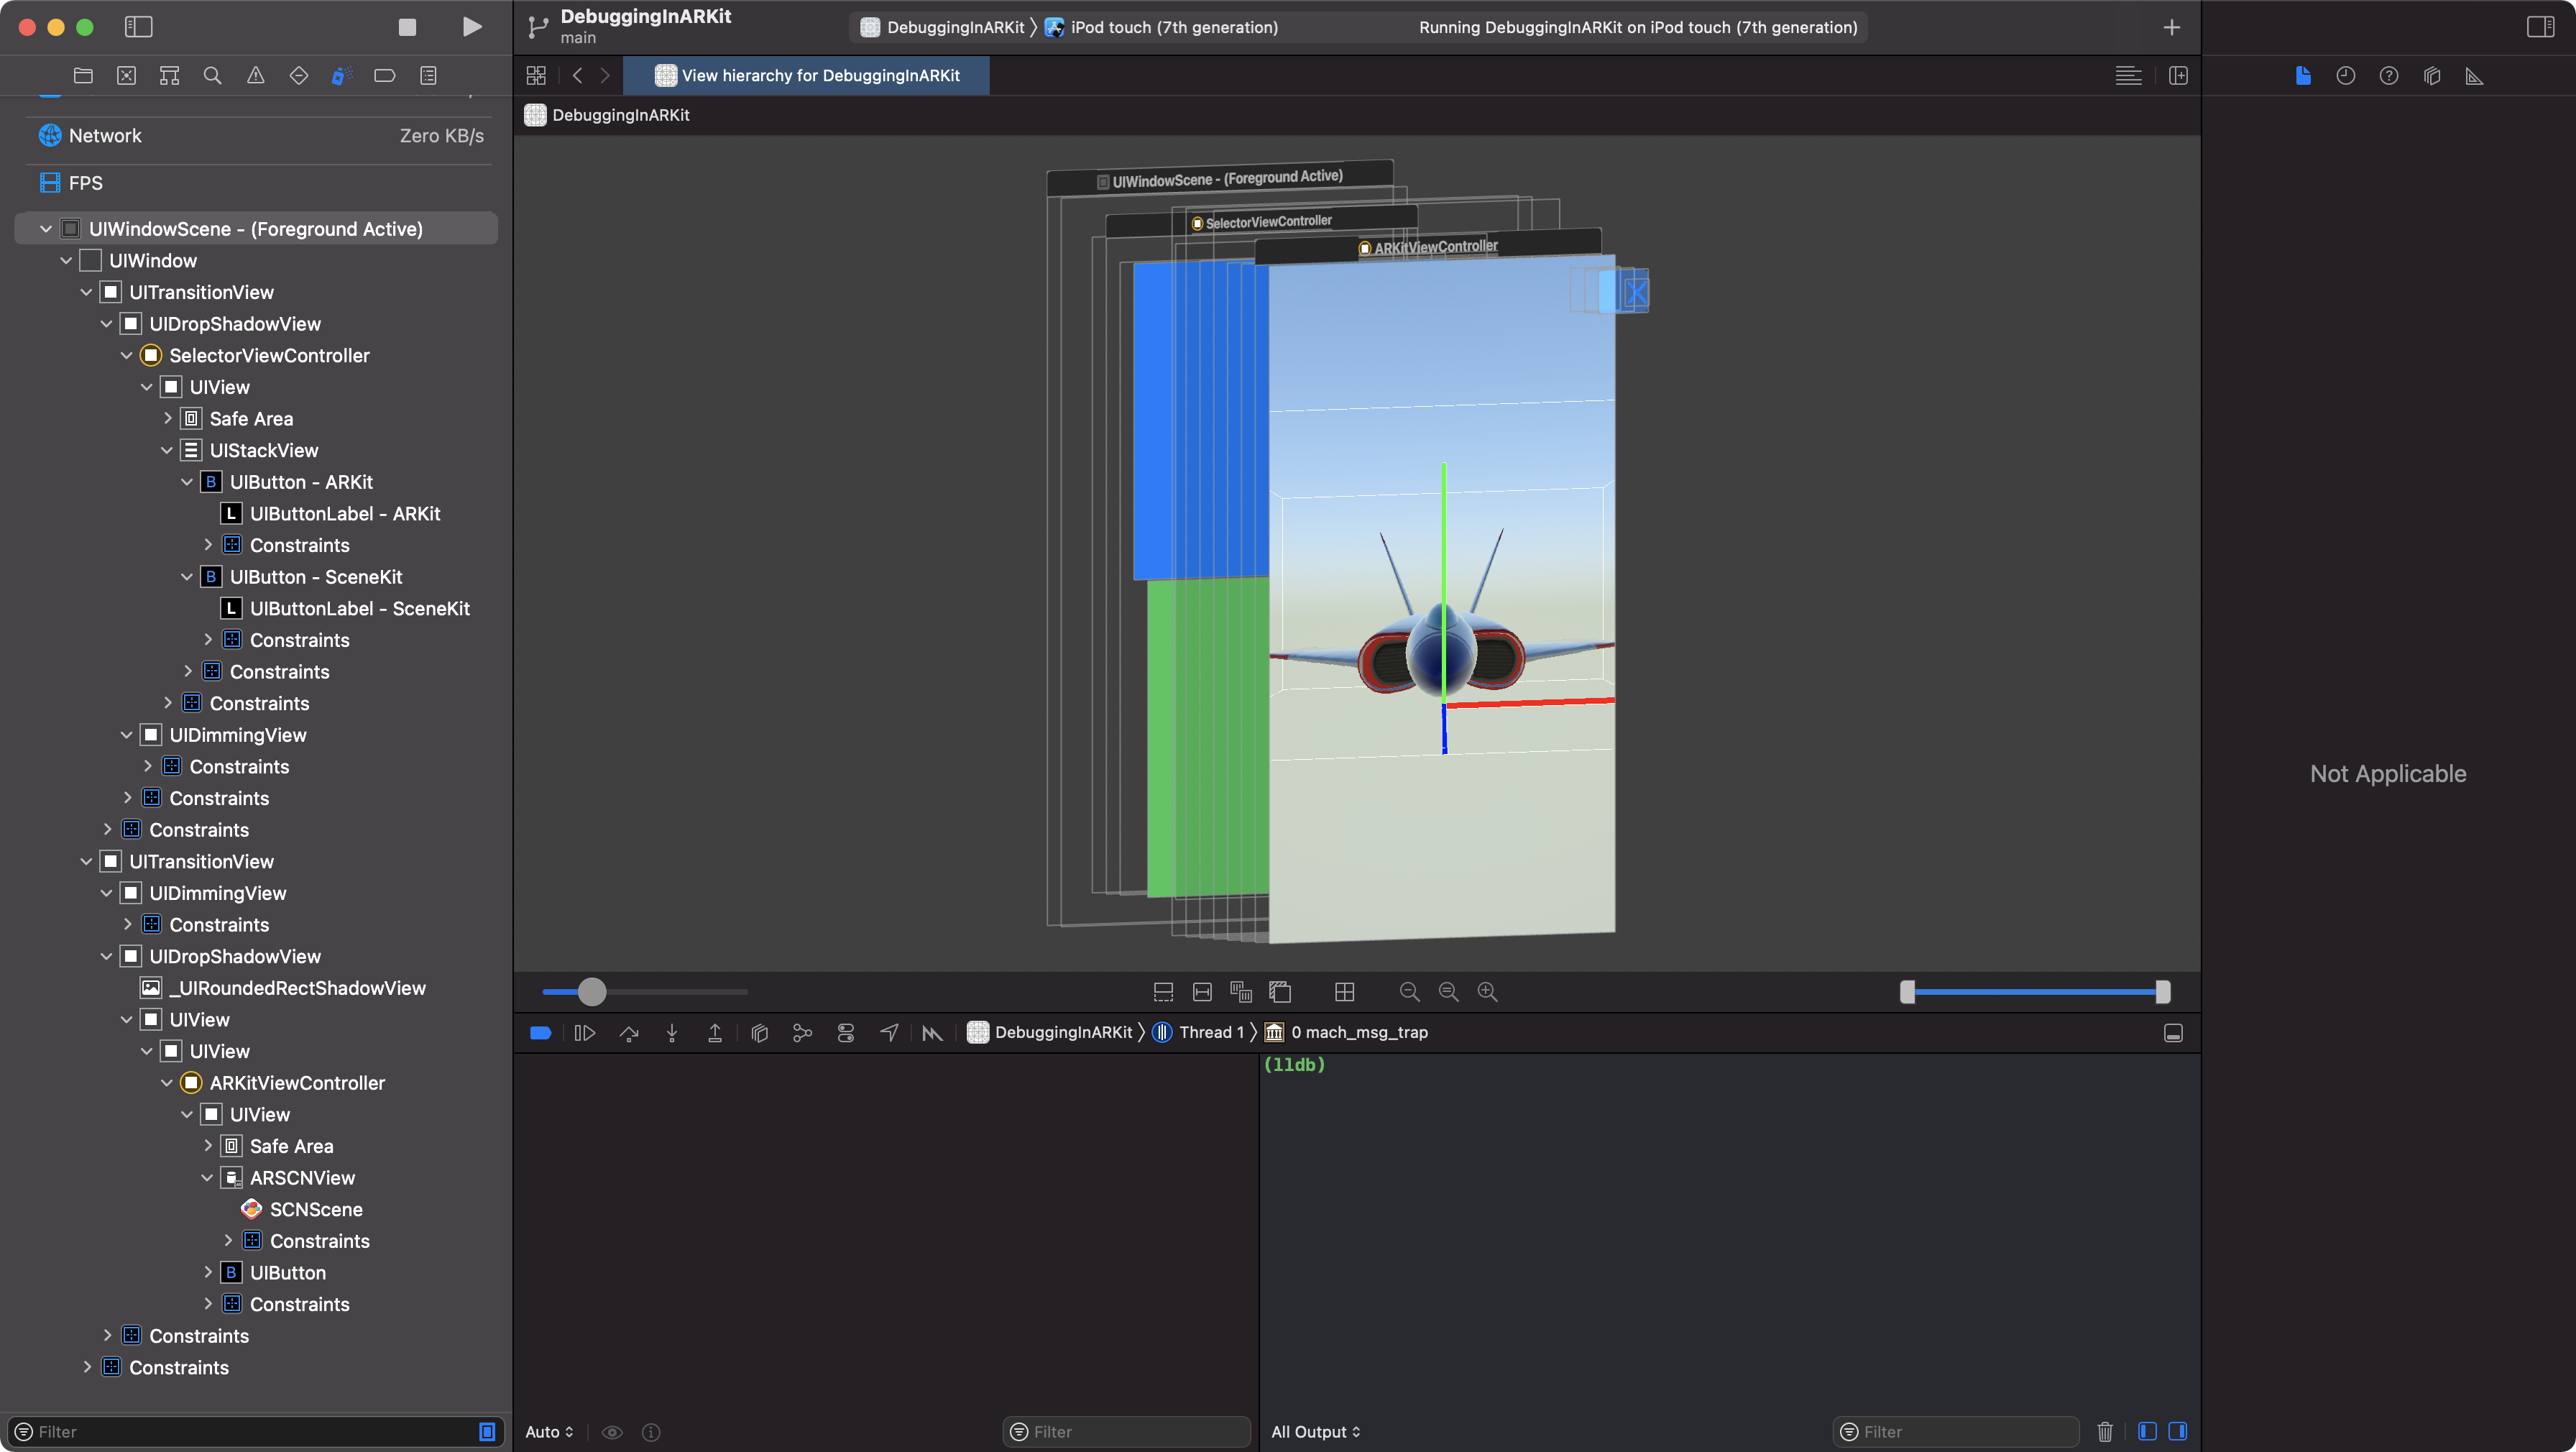
If you want to see the full hierarchy of a scene, click on it in the view hierarchy in the left side panel:

Once you click on that you will be able to clearly check what’s the hierarchy of the scene at the left panel and if you click into an object in the scene you’ll be able to check all its properties at the right panel.
From my personal experience, debugging in this way should be more than enough for most cases, if you’re not dealing with a highly complex scene. If that’s the case, you’ll probably figure out soon or later that debugging in this way won’t always make it, overall it’s slow, frustrating and a pain in the ass once Xcode stops responding or it keeps crashing out of nowhere. If you have reach that point I suggest to keep reading and give a try to other debug methods.
SCNSceneRenderer debug properties
This one is really easy, our ARSCNView (or SCNView) has two built-in properties we can use to debug our scene:
-
showsStatistics: A boolean to display rendering performance statistics. -
debugOptions: An array ofSCNDebugOptionsused to display overlays that show scene content such as node bounding boxes or attached cameras.
Example:
sceneView.showsStatistics = true
sceneView.debugOptions = [.showWireframe, .showBoundingBoxes]
Instruments
This is not my favorite one as, if you reach the point where you have to rely on Instruments, it could mean that either you’re dealing with a really nasty issue (a weird crash, high energy consumption, bad performance, etc.) or that you’re so desperate and clueless about what’s going on that this is your last chance (and possible choice) to find / fix your issue.
Regardless of that, it’s true that once your app become really complex, with lots of animations, assets, custom physics, etc., Instruments can help with your debugging so let’s take a look and see how we can do it.
Firs,t you have to open Instruments app. Once it’s running, select SceneKit:
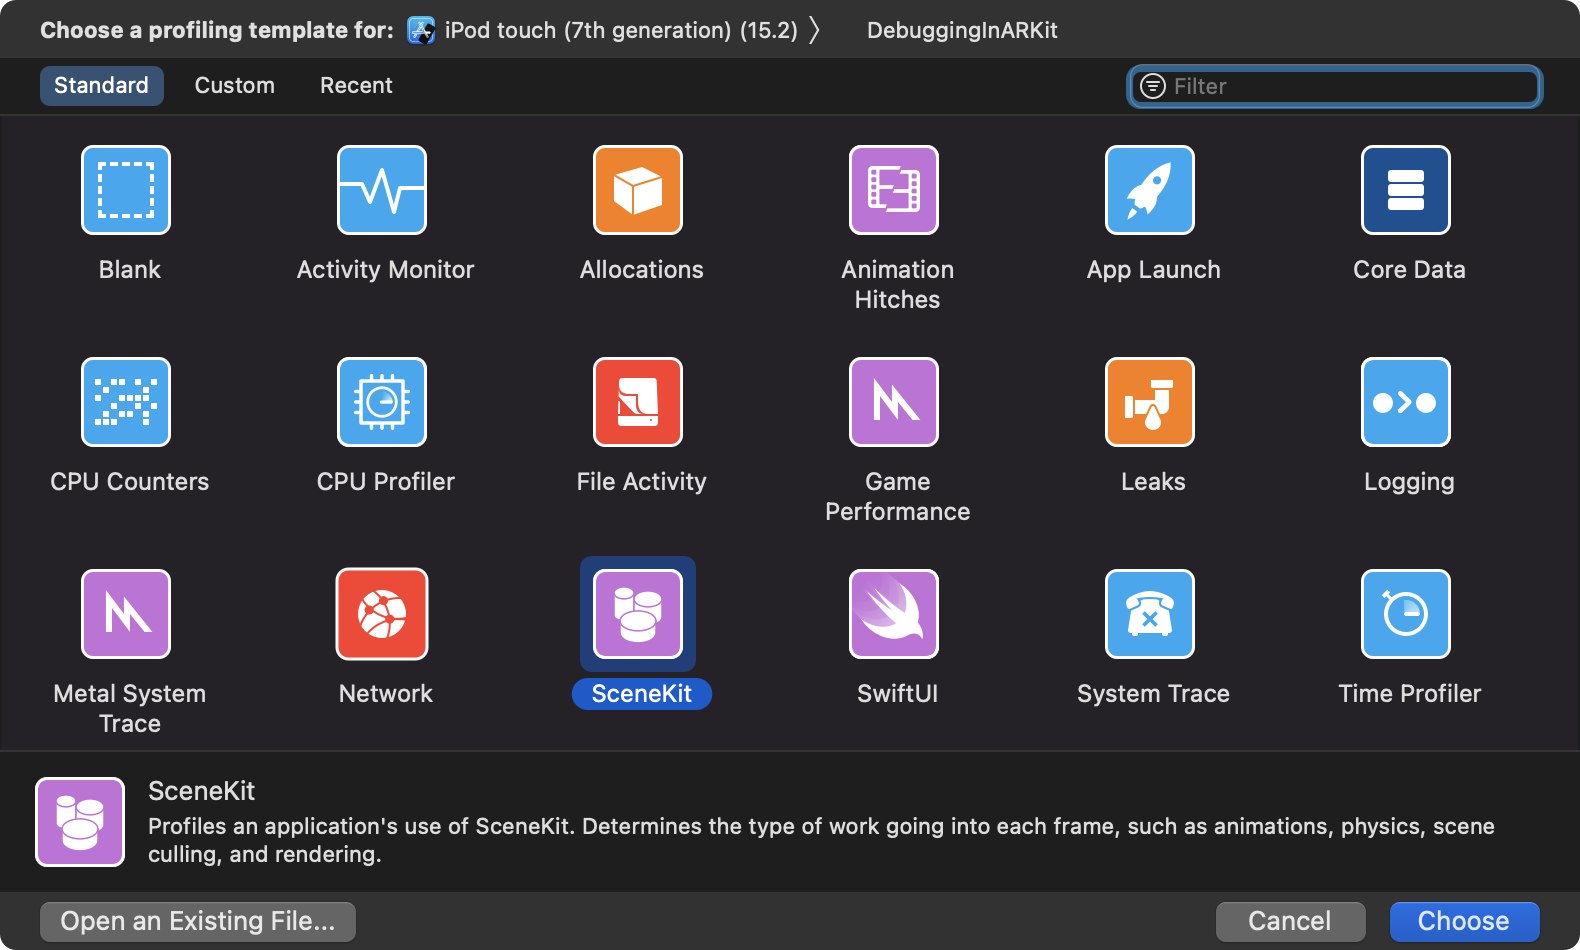
On the next screen, select your device and app (if they’re not already selected):
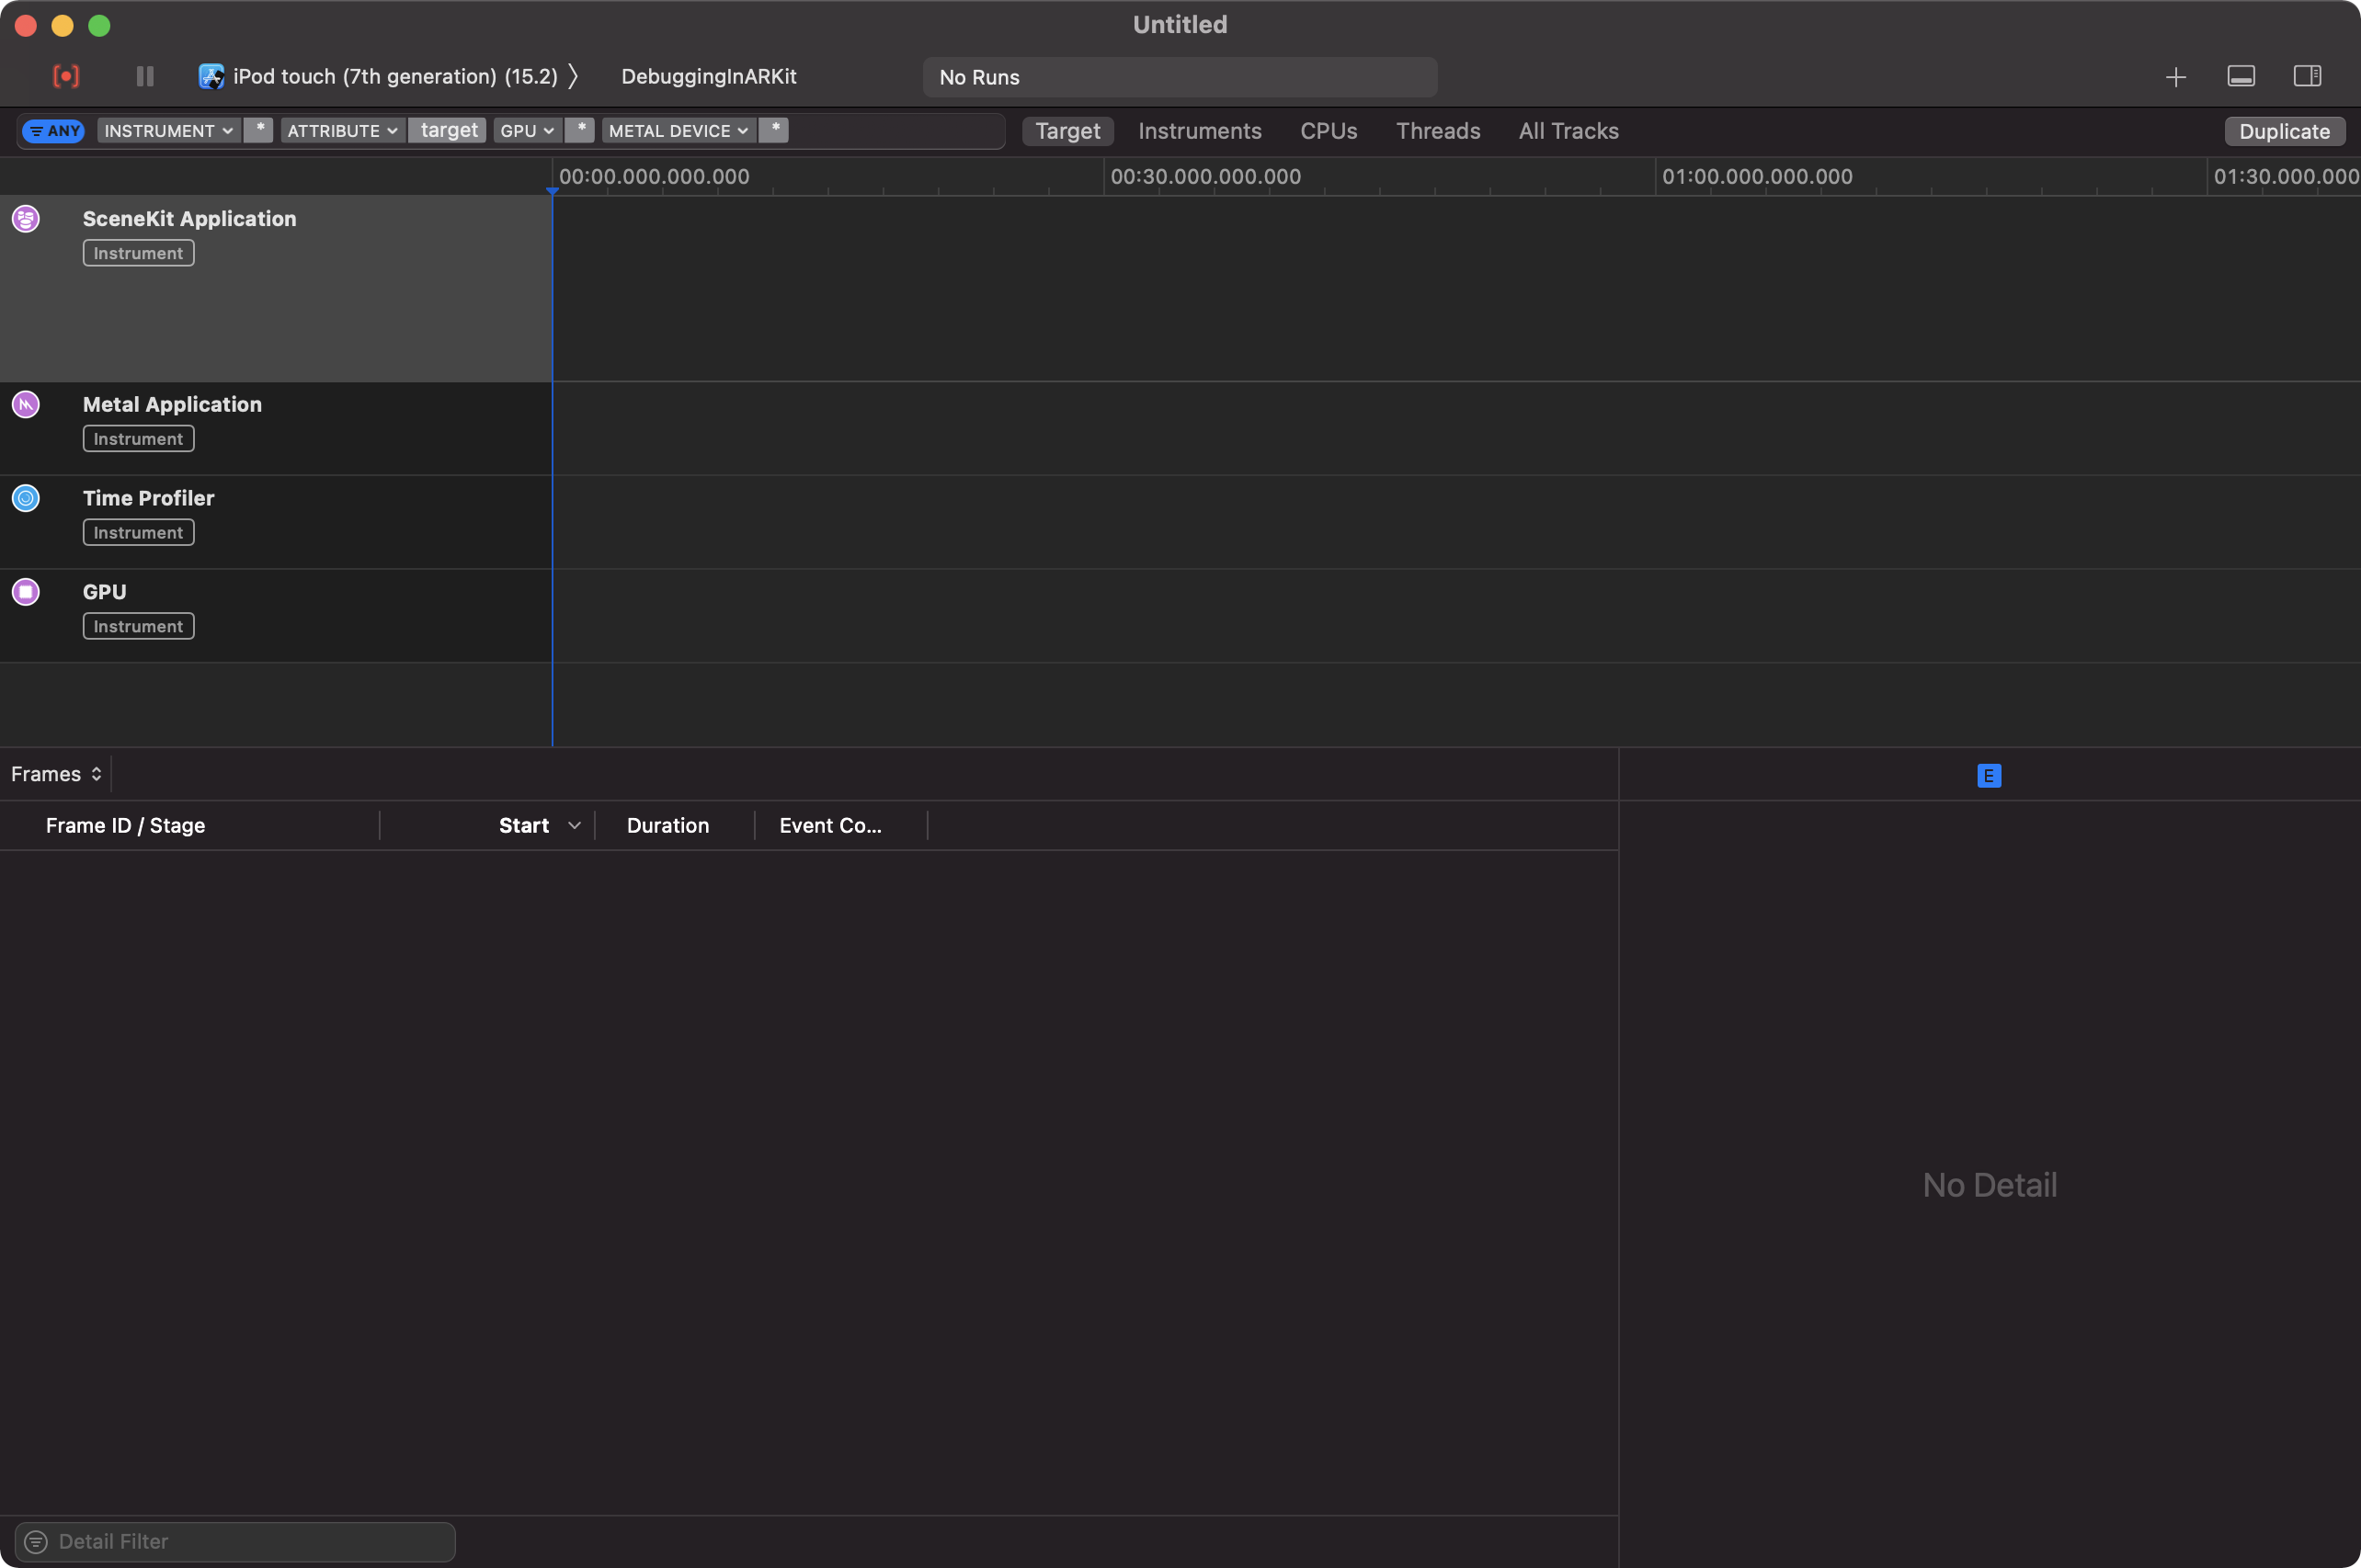
Once that is set, start recording and in parallel try to play around with your app. Once you’re happy with your run, stop Instruments from recording. In the SceneKit Application section you can check frame by frame the performance of your app divided by seven different categories:

This is really useful as you can identify possible bottlenecks in a concrete part of your 3D pipeline and, through the CPU Usage section, correlate to a specific running function for example.
Custom overlays
From an developer perspective, this is the most enjoyable option to do, but, as of course, before building a custom debug overlay you have to think if it makes sense for your project, ask yourself “am I dealing with a huge project with ton of complexity?”, if the answer is no, probably you don’t need this and all the above options and more than enough.
Anyway, I’m going to show how you can extend SCNNode class adding a new property called debugOptions (similar to the one we have for ARSCNView and SCNView).
First, let’s create a SCNNode extension and add this new property there. As you may know, in theory, it’s not possible to add computed properties to extensions. To work around this, I usually rely on objc_getAssociatedObject / objc_setAssociatedObject functions, but for this one I’ll go with a pure Swift approach using this fantastic workaround.
public extension SCNNode {

    enum SCNDebugOptions: String {
        case showLocalAxes
    }

    private static var _debugOptions = [String: [SCNDebugOptions]]()

    var debugOptions: [SCNDebugOptions] {
        get {
            let tmpAddress = String(format: "%p", unsafeBitCast(self, to: Int.self))
            return SCNNode._debugOptions[tmpAddress] ?? []
        }
        set(newValue) {
            let tmpAddress = String(format: "%p", unsafeBitCast(self, to: Int.self))
            SCNNode._debugOptions[tmpAddress] = newValue
        }
    }
}
As you can see, I’ve only added a new debug option called showLocalAxes which, as its name suggest, will display a coordinate axis visualization indicating the position and orientation of the node coordinate system.
So now you can add this new property to any SCNNode instance, but it won’t have any effect apart from holding its value. In order to implement this logic, we have to understand how it’s intended to work. Fortunately, as we’re trying to replicate the same behavior we already have for ARSCNView / SCNView, we know that each time its value is set, either we add or remove options from the overlay.
To achieve exactly that, once a new value is set for debugOptions, we will remove the node axes no matter what and only if that new value contains .showLocalCases, we will add these back:
public extension SCNNode {
    var debugOptions: [SCNDebugOptions] {
        get {
            // ...
        }
        set(newValue) {
            // ..

            // remove axes
            removeAxes()

            // loop through every new value
            newValue.forEach { value in
                switch value {
                // if newValue contains .showLocalAxes, add axes
                case .showLocalAxes:
                    addAxes()
                }
            }
        }
    }
}
I’m not going to explain how to add these visualizations to the node as it’s quite straightforward to do, axis are just child nodes with different rotation to match each axis orientation plus some offset. You can check the full implementation here.
The final result will be something like this: